Install Prometheus on AWS EC2

Let’s face it, there will be something wrong at some point, and you need to know when it is happening. That awesome application you have been working on for 6 months and you treat as your child is going to be in trouble someday. Therefore, how to be there exactly when something needs to be fixed? How do you tell that something is crashing? Obviously, it is not possible for us to be there all the time, so we need something else do that for us. Prometheus is an awesome open-source tool for monitoring, designed for reliability, and meant to be the system you look for during an outage to allow you to quickly diagnose problems.
The content is divided in the following topics:
- Install Prometheus on AWS EC2
- Prometheus Node Exporter on AWS EC2
- Prometheus Discovery Service on AWS EC2
- Prometheus Alertmanager Sending Emails
About AWS Free Tier
AWS offers a Free Tier after creating an account and there are two main types of tiers I want to list:
- 12 Months Free: Starts after you create an account.
- Always Free: Services and resources always free with some limits (e. g. AWS Lambda 1 Million free requests per month).
This means that after creating an account you will have exactly 1 year of free usage of a list of services. To configure and test Prometheus in AWS you could create an account, if you don’t have one already, and consume the Amazon EC2 750 Hours free per month. It is worth to mention that there are still some limits in the Free Tier plan and talking specifically of AWS EC2, if you want to stay within the Free Tier, you must use only EC2 Micro instances. We will review a few concepts along this post to clarify what I mean.
We will need two AWS EC2 instances: one as a Prometheus and the other one will have Prometheus Node Exporter installed. To keep it simple, all the process is manual.
Create an AWS EC2 Instance
Follow the next instructions to launch a new AWS EC2 instance for a Prometheus. If you can’t read from the image, click on it to have a better view.
-
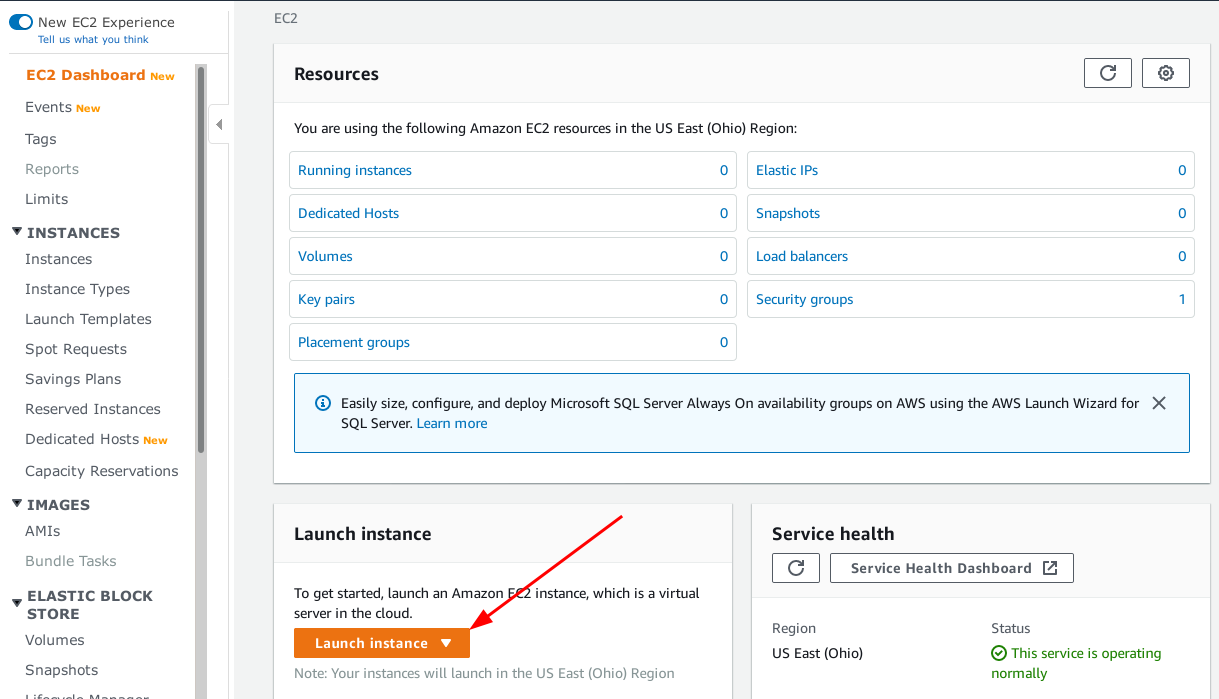
Go to AWS EC2 Dashboard in your AWS Console and start the launch instance wizard.
-
Select
Ubuntu Server 20.04 AMIor any Ubuntu distribution of your like.
-
Choose
t2.microas the desired instance type. Be careful selecting the instance type because not choosing wisely can lead to serious consequences(like paying).
Notice that the next step is to clickNext: Configure Instance Detailsbutton and not theReview and Launchbutton.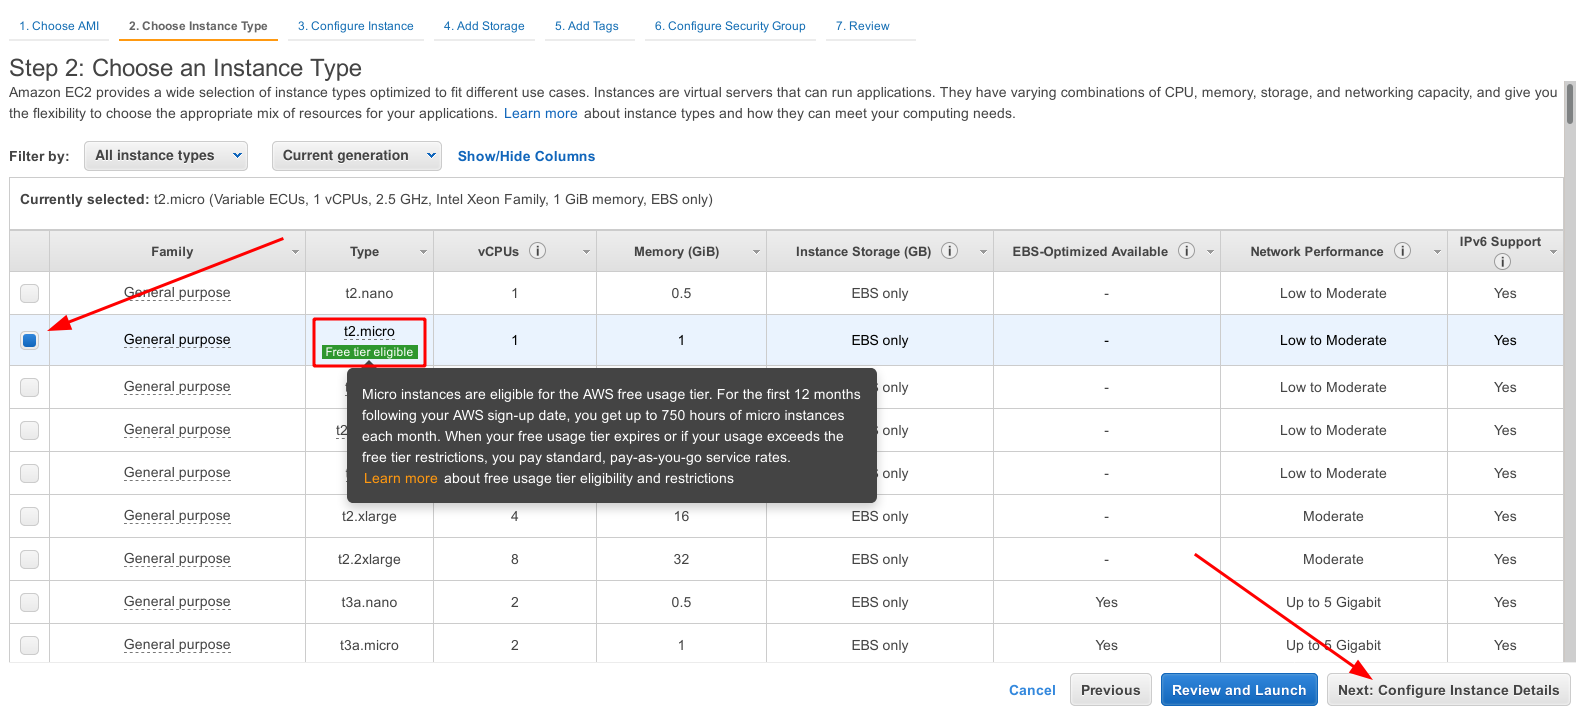
-
Configure the instance details. Notice that I selected the default VPC and the default subnet. You might see other ids but as long you select the default configuration the result is going to be the same. If you want to set a more complex, isolated and secured network it is up to you.

-
Add storage, 8 GB is more than what we need for this example.

-
Add a
Nametag, this is the name of the EC2 instance.prometheus-server.
-
Configure a Security Group. Think of it like firewall rules. We will need port
9090for Prometheus, port9100for Prometheus Node Exporter and finally, port9093for the Alertmanager. For this example, we are going to use a single Security Group for all the AWS EC2 instances to keep it simple.
-
Review instance launch.

-
Create a new Key Pair if necessary. This is an important step because without this key you wouldn’t be able to connect to the AWS EC2 instance.

-
Launch it.

-
Get the Public DNS of the AWS EC2 instance.

Install Prometheus
Now that we have the infrastructure ready we can continue the process. Change the information accordingly to your results.
| Machine | Public DNS | Port |
|---|---|---|
| prometheus-server | ec2-3-17-28.53.us-east-2.compute.amazonaws.com | 9090 |
- Let’s connect to the AWS EC2 instance where we are going to install Prometheus.
prometheus.pemis the key that was generated previously.
ssh -i prometheus.pem ubuntu@ec2-3-17-28.53.us-east-2.compute.amazonaws.com
- It is recommended to create a different user than root to run specific services. This will help to isolate Prometheus and add protection to the system. I really like this stackexchange answer, it could give you a better explanation of why we should avoid the usage of the root user for everything. Also we need to create a directory to host Prometheus configuration and another one to host its data.
sudo useradd --no-create-home prometheus
sudo mkdir /etc/prometheus
sudo mkdir /var/lib/prometheus
- Now we need to install Prometheus.
wget https://github.com/prometheus/prometheus/releases/download/v2.19.0/prometheus-2.19.0.linux-amd64.tar.gz
tar xvfz prometheus-2.19.0.linux-amd64.tar.gz

sudo cp prometheus-2.19.0.linux-amd64/prometheus /usr/local/bin
sudo cp prometheus-2.19.0.linux-amd64/promtool /usr/local/bin/
sudo cp -r prometheus-2.19.0.linux-amd64/consoles /etc/prometheus
sudo cp -r prometheus-2.19.0.linux-amd64/console_libraries /etc/prometheus

sudo cp prometheus-2.19.0.linux-amd64/promtool /usr/local/bin/
rm -rf prometheus-2.19.0.linux-amd64.tar.gz prometheus-2.19.0.linux-amd64
- Initially and as a proof of concept we can configure Prometheus to monitor itself. All what we need to do is create or replace the content of
/etc/prometheus/prometheus.yml.
global:
  scrape_interval: 15s
  external_labels:
    monitor: 'prometheus'

scrape_configs:
  - job_name: 'prometheus'
    static_configs:
      - targets: ['localhost:9090']
- We might want Prometheus to be available as a service. Every time we reboot the system Prometheus will start with the OS. Create
/etc/systemd/system/prometheus.serviceand add to it the following content:
[Unit]
Description=Prometheus
Wants=network-online.target
After=network-online.target

[Service]
User=prometheus
Group=prometheus
Type=simple
ExecStart=/usr/local/bin/prometheus \
    --config.file /etc/prometheus/prometheus.yml \
    --storage.tsdb.path /var/lib/prometheus/ \
    --web.console.templates=/etc/prometheus/consoles \
    --web.console.libraries=/etc/prometheus/console_libraries

[Install]
WantedBy=multi-user.target
- Let’s change the permissions of the directories, files and binaries we just added to our system.
sudo chown prometheus:prometheus /etc/prometheus
sudo chown prometheus:prometheus /usr/local/bin/prometheus
sudo chown prometheus:prometheus /usr/local/bin/promtool
sudo chown -R prometheus:prometheus /etc/prometheus/consoles
sudo chown -R prometheus:prometheus /etc/prometheus/console_libraries
sudo chown -R prometheus:prometheus /var/lib/prometheus
- Now we need to configure systemd.
sudo systemctl daemon-reload
sudo systemctl enable prometheus
sudo systemctl start prometheus
Good job, now we have everything in place but the setup is not complete, we need metrics to feed our brand new Prometheus instance. In the next section we will learn how to setup a node exporter in a second AWS EC2 instance.
More Links:
Prometheus.io - Introduction#features
Digital Ocean - How To Install Prometheus on Ubuntu 16.04
Prometheus.io - Configuring Prometheus to Monitor Itself
Stay updated with new posts


Comments